Pages

Friday, July 15, 2011

Installing Ultra VNC over LAN connection

I had to install Ultra VNC over LAN and WAN and test for all the Windows operating systems such as Windows XP, Windows 2003 Server, Windows Vista, Windows 7 and Windows Server 2008. That was the time I first got my hands on VNC. With outdated documentation, I found it difficult, uninteresting and timewasting. But after putting much effort, I found a great deal about Ultra VNC and other VNC products. With that I was given the task of developing a Remote Desktop application. My knowledge is documented in a series of articles starting from this, with the intention of saving time and energy of anyone who’s reading this.
In this article I’ll explain the task of installing Ultra VNC to work on a Windows 7 machine with screenshots which lacks in many documentations I found for this subject on the internet.

Environment

  • Ultra VNC version: 1.1.9.6
  • Operation System: Windows 8 Ultimate 64-bit

What you need

  1. UltraVNC_1.0.8.2_Setup.exe file (downloaded from UltraVNC home page at www.uvnc.com/download/ )
  2. Active Internet connection (Setup requires to download some files as it installs)

Installation Steps

  1. Execute the exe file.
  2. Select a language.
  3. Accept the ‘License’ document.
  4. Select a destination location.
  5. Select the desired components to install.
  6. Specify a ‘Start Menu’ folder name.
  7. If you are installing on a machine that has Windows Vista or above, you MUST check register as a system service option.

  8. Once all the steps are done finish the installation setup.
There should be 2 machines for the remote desktop concept to make sense. But remote desktop the local machine allow you to verify it’s working. In the remote desktop terminology, server is the machine which we need to remotely monitor or access. On the other hand viewer is the machine from which we remotely monitor the server.
So make sure you install the full setup (only if you are not much familiar with Ultra VNC, otherwise server on targeted machine and viewer on monitoring machine) on both machines and configure them as follows before testing.

Configuring the Ultra VNC Server

  1. Now check your system tray for blue color Ultra VNC logo.
  2. If it’s not there try restarting ‘uvnc service’ or restart your machine.
  3. Right clicking on this icon will give you a menu as below.
  4. Select ‘Properties’ and make sure all options are uncheck.
  5. Now again right click and select ‘Admin Properties’.
  6. In this, in ‘Incoming Connection’ section the displayed 2 ports (i.e Main: 5900 and Http: 5800) can be slightly different depending on your machine’s port availability. The main port number will be required later when connecting to the Ultra VNC server from an Ultra VNC viewer.
  7. Make sure you check ‘Allow Loopback Connections’ in the Incoming Connections section.
  8. Give two different passwords in the ‘Authentication section and remember them, because they will be required when remotely connecting.
  9. In ‘Misc.’ section do tick the first 2 options if you are installing this on a Windows Vista or above OS.
  10. Then apply the settings and press Ok.
  11. After closing the ‘Admin Properties’ reopen it and double check your selections are not changed.
  12. Then restart the ‘uvnc service’ manually.

Configuring the Ultra VNC Viewer

The default setting will be perfectly alright and will not require any configurational changes for the viewer to work.

Initiating Remote Desktop

  1. Start the Ultra VNC viewer.
  2. Specify the VNC Server as <server_ip :: server_main_port> and press ‘Connect’ leaving other options unmodified. It’s wise to first test the VNC installation by remotely connecting to the same machine. That’s why I have connect to localhost in port 5900 which is set in my Ultra VNC server’s ‘Admin Properties’.
  3. If is the Ultra VNC server is runing in the ip that you have provided  and in the port you have mentioned you will see a connection status dialog box and a prompt for server password which you entered in the Ultra VNC server ‘Admin Properties’.
  4. If you want only to remotely view the machine, provide the view only password. If you want to actually work on the remote machine specify the vnc password and log in.
  5. If you have correctly installed and configured the Ultra VNC setup and you are connecting to the local machine from itself you will see something like this, else you will see the correct remote desktop screen of your Ultra VNC server machine.
  6. While a machine is remotely accessed by Ultra VNC, it will not interrupt the logged in user session as in ‘Windows Remote Desktop’. But you can detect that you are been monitored if your machine’s Ultra VNC server icon in the system tray goes yellow from default blue. It’s always yellow if viewers are connected to it.
That’s it for UltraVNC over LAN, hope I saved some of your time with Ultra VNC. Good Luck!

Wednesday, July 13, 2011

Dynamic Column RDLs

When creating reports in RDL there may be cases where you want to represent data in a table, but table column are chosen by the user at the runtime. Assume you have no clue about how many columns will the user choose for the table and what kind of data will it represent.

Normal tables in reports require statically laid columns with statically defined expressions to populate data in them. Matrix comes handy in situations like these. I have explained how to use a matrix to create a table with dynamically populated columns using Business Intelligent Studio that comes with SQL Server Reporting Service (SSRS).

To use this feature database query should result in the following format.

Employee ID (emp_id)

Column Name (col_name)

Column Value (col_value)

1

Name

John

1

Age

25

1

Designation

Software Engineer

2

Name

Smith

2

Age

31

2

Designation

UI Designer

  1. Add a ‘Matrix’ from the toolbox to the canvas
  2. Set the necessary basic elements in the report. Such as Data Source, Data Set, Parameters, etc.
  3. In the newly added matrix insert a ‘Row Group’, and a ‘Column Group’ as follows,
  • Row Group: rows should be group by employee id. In this case ‘col_name’. Hence no 2 employees can have same employee id. If it happens to be, then the initial employee records get overwrite by the second employee who has the same id value.
  • Column Group: columns should be group by column name. In this case ‘col_name’. Hence no 2 columns can have the same name.
  • Cell value should be the data value that satisfies both Column and Row Group conditions. In this case ‘col_value’.

Employee ID <- This is a text box

col_name <- Column Name field

emp_id<- Employee ID field

col_value <- Column Value field

Now when this RDL is deployed and viewed, it will output a table as follows,

Employee ID

Name

Age

Designation

1

John

25

Software Engineer

2

Smith

31

UI Designer

Hence no knowledge is required on number of columns or their content when creating this kind of tables.

SSRS Reports Generation

Creating a New RDL

SQL Server Reporting Service (SSRS) require its reports to be generated in Report Definition Language (RDL). Package also contains a Visual Studio Environment to Develop RDLs, named Business Intelligent Studio.

Shown below is a report in Business Intelligent Studio.
Visual area of the report is the canvas. All items on it will be shown in the final published report when viewed. tabular, matrix, charts, labels, images can be drag and dropped to the canvas from the Toolbox (shown vertically on the very left edge in the above image). once the report layout is created you can bind data to it. For any functional report there are few main parts to configure. They are,
  •  Data Source  - which defines the connection string and the credentials to the database.
  • Data Set – which defines the query to execute on the ‘Data Source’ to fetch  data. ‘Fields’ are the returned data attributes for the Data Set.
  • Parameters – these are user inputs that may required by the Data Set queries for the report.
  • Chart, tabular, matrix, label items to be shown in the report.

Adding a New Report Item


  1. Create a new Report Project.
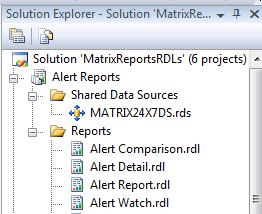
  2. In the solution Explorer do the following changes.
  3. Add a shared data source to access the database.
  4. Right click on ‘Reports’ folder and add a new report Item.
  5. If ‘Report Data’ View is not visible in the workbench, go to ‘View’ menu and select ‘Report Data’.

Setting up Report Data Source and the Data Sets


  1. In the ‘Report Data’ select ‘New -> Data Source’ and point the new data source to the existing shared data source ‘MATRIX24X7DS’.
  2. In the same manner in ‘Report Data’ select ‘New -> Data Set’. In creation the ‘Data Set’ you have to specify the database stored procedure (sp) or the direct query relevant to this dataset. 

Parameters for a Report

Parameters are the only method of getting user input for the report. When adding data set queries the user inputs required for the query to execute are automatically get added under ‘Parameters’ section. we can add new parameters, modify existing ones or even remove them as required.
  1. To add a new Parameter, in the ‘Report Data’ select ‘New –> Parameter’ and follow the wizard.
  2. To modify right click on an existing parameter and choose ‘Properties’
  3. To delete parameter right click and then select ‘Delete’
There are varies methods of taking user inputs using parameters.
  1. If required a date as a input in the wizard select type to be ‘Date’
  2. If you want the user to select from know list of values in the wizard add label-value pairs in the ‘Available Values’ section that will display a dropdown list in the runtime.
  3. If you want to set a default value to a parameter set it in the ‘Default Value’ section of the wizard.
  4. If you don’t want the user to see a parameter mark it as ‘Hidden’ in the wizard.
  5. If the data to available values should be obtain from the database select ‘By Query’ in the ‘Available Values’ section.
  6. If you want the user to provide no input select ‘Allow null’ option.
  7. If you want user to select more than one option from the all available values, select ‘Allow multiple inputs’.
  8. If you want parameters to show available values base on multiple values selected from a previous parameter by the user, set the dependent parameter ‘Available Values’ to previous parameter. set Label to ‘<prev_param>.label’ and Value to ‘<prev_param>.value’

Adding Charts


Column Chart


  1. Add a column chart from the toolbox, select chart type column and hit ‘Ok’.
  2. In chart properties set ‘DataSetName’
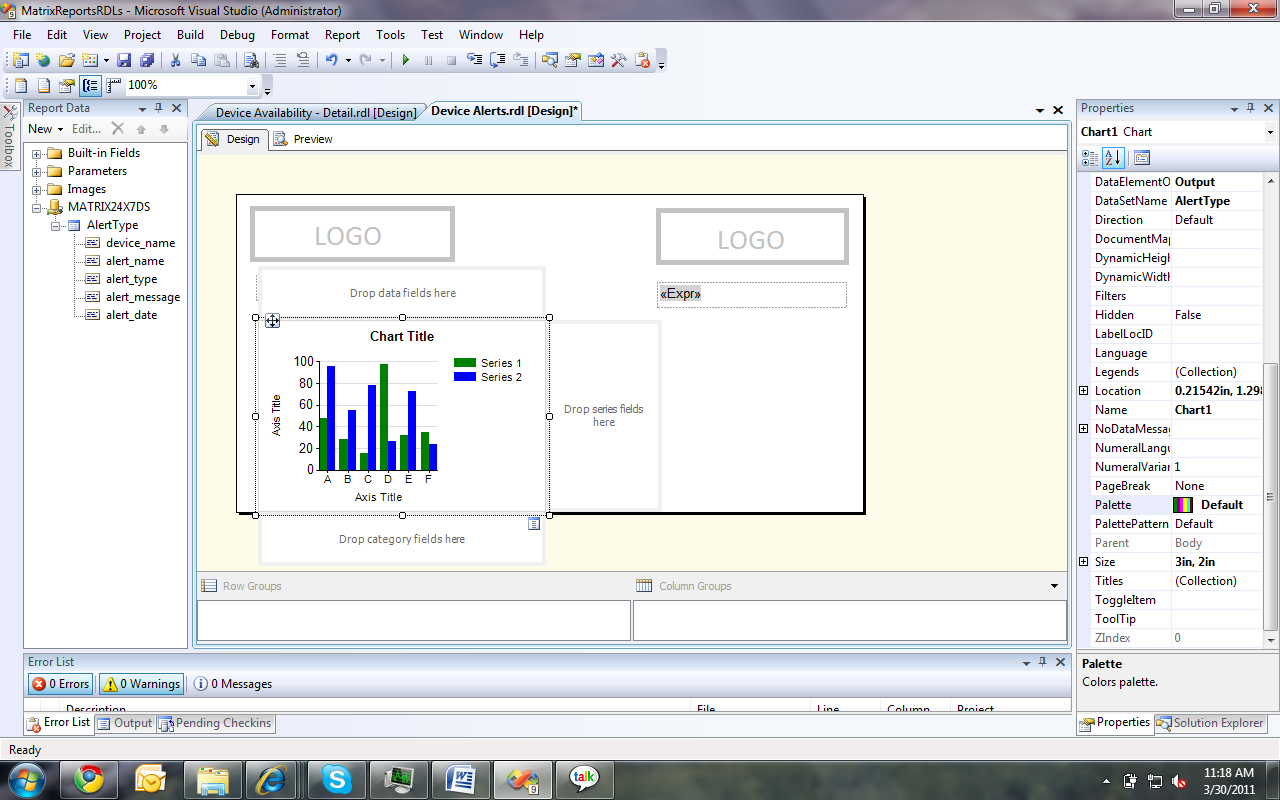
  3. Click inside the chart again. Something similar to above image should appear.
  4. Moving mouse over top right corner of all the 3 drop fields will make the selection button appear in blue as for the ‘Drop category field’ in the above image.
  5. In ‘Drop category fields’ click on the selection button and select the data field required for the x-Axis of the chart.
  6. In ‘Drop data fields’ click on the selection button and select the field that was selected for the category field. It will be shown as ‘Count(category_field)’.
  7. Double click on the ‘Chart Title’ and two ‘Axis Titles’, and give the relevant names for them.
  8. Drag and resize the chart as required.
  9. Go to the ‘Solution Explorer’ right click the report and select ‘Build’.

Bar Chart


Creating a bar chart is identical to column chart except the fact that chart type should be ‘Bar’ and hence will not be discuss again.
 

Pie Chart


Creating a pie chart is identical to column chart except the fact that chart type should be ‘Pie’ and hence will not be discuss again.
 

Line Chart


Creating a line chart is identical to column chart except the fact that chart type should be ‘Line’ and hence will not be discuss again.
 

Table


  1. Add a ‘Table’ instead of a chart to the canvas.
  2. Select the table and go to the property window of the table. Set the properties ‘DataSetName’.
  3. Type the column names in the header row.
  4. Select data set fields by clicking the top right corner blue icon and then the required field name in all the columns in the detail row.
  5. Leave the footer row empty or remove. It’s again a static row like the header row.
  6. Set borders, font style and cell background color by right clicking and selecting ‘Properties’ for cells.


Matrix Table


Matrix can be used populate dynamic columns when the creator has no prior knowledge on number of columns. To use this feature database query should result in the following format.
Agent ID Column Name Column Value
A Col_1 Val_1
A Col_2 Val_2
A Col_3 Val_3
B Col_1 Val_4
B Col_2 Val_5
B Col_3 Val_6
  1. Add a ‘Matrix’ from the toolbox to the canvas
  2. Set Matrix’s ‘DataSetName’ in the property plane.
  3. Insert a ‘Row Group’, and a ‘Column Group’ as followed
Agent ID <- This is a text box Col <- Column Name field
Id <- Agent ID field Val <- Column Value field
Now when this RDL is deployed and viewed, it will output a table as follows,
Agent ID Col_1 Col_2 Col_3
A Val_1 Val_2 Val_3
B Val_4 Val_5 Val_6


Multiple Series Charts


  1. Add any chart from the toolbox In the above case it’s a line chart.
  2. Set chart’s ‘DataSetName’ property.
  3. Select a x-axis field from ‘Drop category fields’ top right corner selection button.
  4. Select a group by field from ‘Drop series fields’ same as above.
  5. Select a data field from ‘Drop data fields’ same as above.
  6. Set x-axis title and y-axis title.


Tuesday, July 12, 2011

Microsoft SQL Server Reporting Service (SSRS)

Overview

SQL Server Reporting Service (SSRS) is a server based reporting platform introduced by Microsoft. It’s reliable, comprehensive reporting platform distributed with Microsoft SQL Server since the introduction of ‘SQL Server 2000’ in year 2004.

Same as its competitors such as ‘Crystal Reports’, ‘IBM Cognos’, etc. SSRS also provides attractive features in the areas of data representation, report management and report viewing. SSRS is fully compatible with SQL Server, SharePoint  and uses Visual Studio environment. Yet it can be used with many other commercial and open source DBMSs as mentioned in the features section below.

There are 3 main stages in SSRS report life cycle. They are,

1. Report Creation – Report is defined using the ‘Report Definition Language’ (RDL) which is a XML based markup language. ‘Business Intelligent Studio’ which uses Visual Studio environment can be used to generate reports.

Report

2. Report Deployment – Once the reports are developed they are deployed in a central location in the Reporting Server.

Report5

3. Report Viewing – Once successfully deployed, reports can be viewed through any web connection, expose them through a web service, or publish them directly to a SharePoint site. These published reports can be exported to many formats like PDF, Excel, TIFF, XML or print or even subscribe to by uses. Subscriptions are delivered as Emails or Publish to FTP servers.

7-13-2011 8-43-32 PM

More information regarding SSRS architecture can be found at SSRS home page in MSDN, http://msdn.microsoft.com/en-us/library/ms159106.aspx.

SSRS can be used to produce reports in a business enterprise or can be customized and integrated to custom applications which has a SQL Server based back-end. For whatever the requirement it’s always advantageous to analyze pros and cons of using SSRS to meet your reporting requirement.

Features of SSRS

  • It’s fully compatible with SQL Server Database, SharePoint servers and Visual Studio development environment.
  • Supports relational, multidimensional, XML or custom data sources such as Microsoft SQL Server, OLE DB, Microsoft SQL Analysis Service, Oracle, ODBC, XML, Report Server Model, SAP NetWeaver BI, Hyperion Essbase, TERADATA.
  • Data can be represented in tabular, matrix, charts, images, labels and many other forms.
  • DB logics can be loosely coupled from the business logics that are used to compose the report by calling the Database stored procedures from the RDL.
  • Generated report can be viewed using web and exported to many formats including PDF, Excel, Word, TIFF, HTML, MHTML, CVS, XML, etc.
  • Users can subscribe to reports by configure the SSRS to deliver them in a scheduled time or in intervals as Emails or as FTP file shares.
  • SSRS expose many of its functionalities such as getting report parameters, getting the report output, subscribing to a report, deleting a report, building a report and many more by a Web Service to the outside that can be used to integrate the SSRS features to your custom applications.
  • SSRS provides drill down and parameterized reports.
  • Business Intelligent Studio provides drag and drop features for easy report generations.
  • Anyone with a fair knowledge can develop a custom rendering extension to process the RDL and generate reports.
  • Exported report XMLs can be easily transformed in to any desirable format with the use of a simple XSLT file.
  • SSRS is continuously supported and enhanced by Microsoft since year 2004. Hence has a fairly good documentation support with MSDN.

Weaknesses of SSRS

  • It doesn’t expose all its functions such as drill down facility through its web service. List of all exposes methods can be found at http://msdn.microsoft.com/en-us/library/ms155071.aspx
  • If you are generating and showing reports through SSRS other than directly retrieving raw data from the database it may include additional delays.
  • From SSRS 2005 to 2008 there is slight difference of XML output, and the subscription xml generated by the reporting server that looses direct backward compatibility. Since they are not huge changes, those can be incorporated while development. This will matter only if you use SSRS as the backend of your custom application.